如何运行统计测试来寻找跨三种不同表型的特定基因的过度富集?
问题描述 投票:0回答:1
这是我的应急表:
Gene_group  phenotype1  phenotype2  phenotype3
Gene_group1 2   4   26
Gene_group2 0   0   1
Gene_group3 2   6   4
Gene_group4 1   0   0
Gene_group5 0   0   2
Gene_group6 0   0   1
Gene_group7 0   0   1
Gene_group8 0   1   1
Gene_group9 3   0   6
Gene_group10    0   0   1
我想确定一种表型显着富集于其他两种表型的基因组。我是否正确地认为我需要对每个基因组使用 3x2 矩阵,以行方式运行 Fisher 精确检验?对于每个基因组,我想为 p 值添加一个新列。那么我是否需要额外的一列来进行多重测试校正 p 值(可能使用 Bonferroni 校正)?
当我说3x2矩阵时,我认为每个基因组的数据都可以用3x2矩阵格式表示,其中:
- 列:代表三个表型类别(表型1、表型2、表型3)
- 行:两行代表正在测试的基因组的计数和其余基因组的计数。
为此,我尝试了以下方法:
# Load library
library(dplyr)
# Create contingency table as a data frame
contingency_table <- data.frame(
Gene_group = c("Gene_group1", "Gene_group2", "Gene_group3", "Gene_group4", "Gene_group5", "Gene_group6", "Gene_group7", "Gene_group8", "Gene_group9", "Gene_group10"),
phenotype1 = c(2, 0, 2, 1, 0, 0, 0, 0, 3, 0),
phenotype2 = c(4, 0, 6, 0, 0, 0, 0, 1, 0, 0),
phenotype3 = c(26, 1, 4, 0, 2, 1, 1, 1, 6, 1)
)
# Function to run Fisher's exact test for each Gene group
run_fisher_test <- function(gene_group_row, total_counts) {
# Extract the counts for the current ST group
current_counts <- as.numeric(gene_group_row[2:4])
# Counts for the remaining groups
remaining_counts <- colSums(total_counts[-which(total_counts$Gene_group == gene_group_row$Gene_group), 2:4])
# Create the contingency table
contingency_matrix <- rbind(current_counts, remaining_counts)
# Run Fisher's exact test
test_result <- fisher.test(contingency_matrix)
return(test_result$p.value)
}
# Apply the function to each row of the contingency table
contingency_table <- contingency_table %>%
rowwise() %>%
mutate(p_value = run_fisher_test(cur_data(), contingency_table)) %>%
ungroup() # Ungroup after rowwise operations
# Total number of tests
num_tests <- nrow(contingency_table)
# Adjust p-values using Bonferroni correction
contingency_table <- contingency_table %>%
mutate(adjusted_p_value = p.adjust(p_value, method = "bonferroni")) %>%
mutate(bonferroni_significance = 0.05 / num_tests) # Calculate the Bonferroni significance level
# View the results
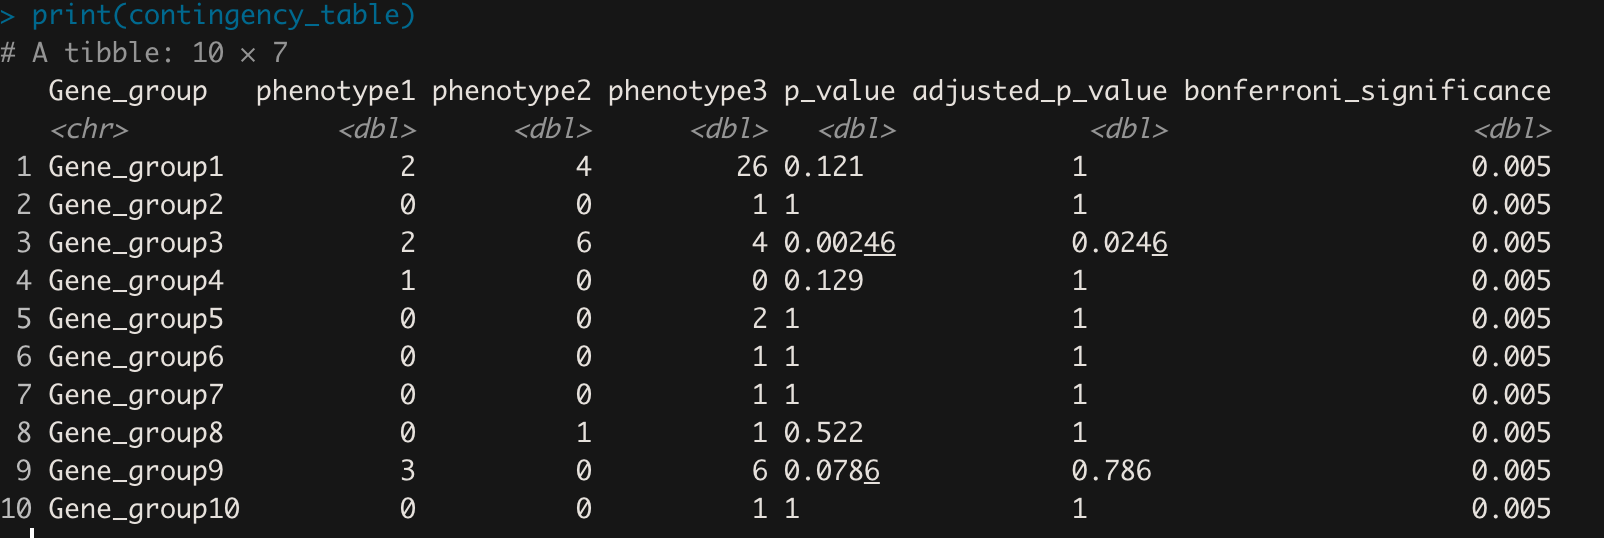
print(contingency_table)
结果如下所示:
所有这些听起来都是正确的方法吗?
然后,我还想运行 2 x 2 Fishers 精确检验来查看表型 1 或表型 3 显着富集的基因组,将 p 值和多重测试校正的 p 值添加到每个基因组的附加列中。
我是 R 编码新手,所以任何建议都会非常有帮助。
1个回答
0
投票
投票
你的代码对我来说看起来不错。对于单个表型(表型 1 与表型 2+3 和表型 3 与表型 1+2),您可以使用以下稍作修改的代码,该代码向您的函数添加另一个参数,并确定用于对其他列求和的索引。
run_fisher_test2 <- function(gene_group_row, total_counts, phenotype) {
# Add these lines
  pheno_col <- grep(substitute(phenotype), names(total_counts))
  pheno_other <- setdiff(2:4, pheno_col)

  # Extract the counts for the current ST group
  current_counts <- c(phenotype, sum(gene_group_row[pheno_other]))

  # Counts for the remaining groups
  remaining_counts <- colSums(total_counts[-which(total_counts$Gene_group == gene_group_row$Gene_group), 2:4])

  # Add this line
  remaining_counts <- c(remaining_counts[pheno_col - 1],
                        sum(remaining_counts[pheno_other - 1]))

  # Create the contingency table
  contingency_matrix <- rbind(current_counts, remaining_counts)

  # Run Fisher's exact test
  test_result <- fisher.test(contingency_matrix)

  return(test_result$p.value)
}

contingency_table <- contingency_table %>%
  rowwise() %>%
  mutate(p_value1 = run_fisher_test2(cur_data(), contingency_table, phenotype1),
         p_value3 = run_fisher_test2(cur_data(), contingency_table, phenotype3)) %>%
  ungroup()  # Ungroup after rowwise operations
# A tibble: 10 x 6
   Gene_group   phenotype1 phenotype2 phenotype3 p_value1 p_value3
   <chr>             <dbl>      <dbl>      <dbl>    <dbl>    <dbl>
 1 Gene_group1           2          4         26   0.141   0.0536
 2 Gene_group2           0          0          1   1       1
 3 Gene_group3           2          6          4   0.645   0.00489
 4 Gene_group4           1          0          0   0.129   0.306
 5 Gene_group5           0          0          2   1       1
 6 Gene_group6           0          0          1   1       1
 7 Gene_group7           0          0          1   1       1
 8 Gene_group8           0          1          1   1       0.522
 9 Gene_group9           3          0          6   0.0831  1
10 Gene_group10          0          0          1   1       1
然后您可以使用当前代码添加调整后的 p 值。
顺便说一句,
cur_data()pick(everything())最新问题
- varnish 无法占用 ec2 机器上的 80 端口
- SwiftUI - onTapGesture 中绑定变量的比较(切换网格中行的选择)
- 有没有可以编译C++或C的库
- 我的 CS50 第 2 周的拼字游戏解决方案与符号作斗争。想不通为什么
- 我可以计算某个值的百分比并总结每个采样日期的此信息吗?
- 如何设置 Minecraft Villager 实体到某个位置的路径?即使用 Spigot API 让生物步行到特定地点
- 如何使用 Excel VBA 以编程方式导入 Excel VBA 模块?
- 使用重复的步骤定义运行不同的 Cucumber 套件
- GetElementsByID() 与 QuerySelector()
- 使用python过滤pdf
- Tilera 交叉编译 - 关于此错误的任何想法:未知的 asm 约束字母
- 片段未覆盖整个屏幕
- Redshift 的前向和后向 REGEX 替代方案 [已关闭]
- Firestore onDocumentWritten 触发器未在使用节点的 Cloud Functions 中进行文档写入时触发
- RPi4 上的 QNX 如何首次登录
- 问题中的一个heap-use-after-free错误--Design MyLinkList(LeetCode No.707)
- 如何在多列上创建FULLTEXT索引?
- Visual Composer 到 HTML
- 计算给定电阻邻接列表的总电阻
- 如何阻止空 iframe 在注入时触发加载事件?
© www.soinside.com 2019 - 2024. All rights reserved.